Introduction #
xLytix graphical drag-and-drop interface enables users to create pipelines with dependencies and schedules effortlessly. This facilitates the development, scheduling and monitoring of batch-oriented workflows. The tool incorporates built-in features for in-depth analysis, workflow resumption from failure points and automated notifications.
Create Pipeline #
1. Click on the Spaces menu option on the main navigation bar to bring up a list of all available spaces and choose the required space.
2. Once inside the space, you’ll see the Pipeline menu option on the main navigation bar on the left side of your screen. Click on Pipeline and then on + Add.
3. Click on Data Sync to add it to the pipeline and select a connection from the list. Join it to the Start node.
4. Click on Data Model to add it to the pipeline and select a model from the list. Join it to the previous node or the Start node as per the need.
5. Set the Frequency of the Schedule and fill other required parameters like pipeline name, description and settings.
6. Click on + Create to save the pipeline. Users can also trigger pipeline runs manually by clicking on Run and also view the pipeline logs by clicking on Jobs.
Edit Pipeline #
1. Navigate to Pipeline tab by clicking on Pipeline. Select the pipeline to edit an click on Pipeline Details.
2. Click on Edit and make changes to the required parameters.
3. Click on Save to save the updated pipeline.
Delete Pipeline #
1. Navigate to Pipeline tab by clicking on Pipeline. Select the pipeline to be deleted and click on Pipeline Details.
2. Click on Delete. Alternatively, you can also delete it on the Pipelines page, by clicking on the Delete icon under the pipeline.
Pipeline Home Screen Buttons #
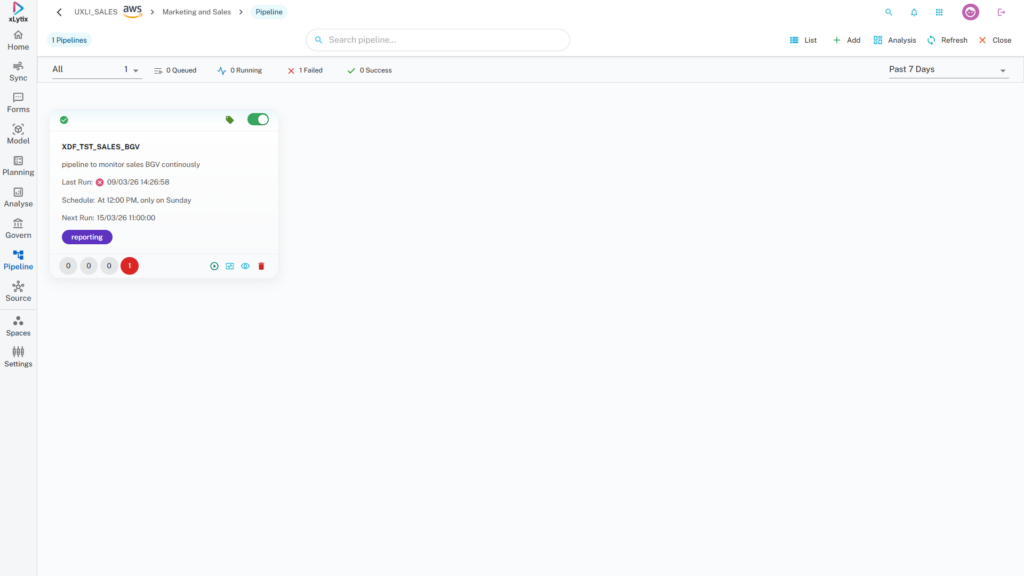
1. Run Pipeline (Green): Manually triggers the pipeline to run.
2. Monitor Pipeline (Blue): Allows to monitor the pipeline in depth with job logs and view job nodes in detail.
3. Pipeline Details (Blue): Opens the pipeline and the settings.
4. Delete (Red): Deletes the pipeline.
5. Numeric Data on Card View: Show the statistics related to 4 parameters of the pipeline – Queued, Success, Running and Failed.
Monitor Pipeline #
1. Navigate to the Pipeline tab from the left navigation panel. Select the required pipeline and open the Pipeline Details page.
2. Click on Monitor Pipeline to open the pipeline monitoring view.
3. The Monitor page displays the pipeline execution flow along with all the stages and tasks involved in the pipeline.
4. Each stage in the pipeline (such as Start, Execute, and Check Status) is visually represented, allowing users to track the execution progress of the pipeline.
5. The Run history section at the bottom displays details of all pipeline runs including:
Run Type, Scheduled Run Time, Status, Run Date, Start Time, End Time, Execution Time and Notes.
6. Users can click on any pipeline run to view detailed execution information for that specific run.
7. Click on Runtime Profile to view the performance metrics and execution details of the pipeline run.
8. Click Refresh to reload the monitoring page and view the latest pipeline execution status.
9. Click Close to exit the monitoring view and return to the pipeline details page.