Introduction #
xLytix offers a variety of features designed to simplify the data analytics shift from a variety of sources such as SAP, Snowflake, PostgreSQL, RedShift, etc. to native cloud technology, with the ability to extract data from the source systems and load it into a cloud destination.
In this guide, we will walk you through the process of using xLytix from exploring the xLytix user interface, setting up source systems and cloud destinations and then walk you through how to create and configure data syncs, jobs, and schedules. We’ll also cover how to monitor your data integration processes and build data models using the Data Modeller. Additionally, we will also cover how we govern and analyze the data.
Home Screen #
Top Toolbar #
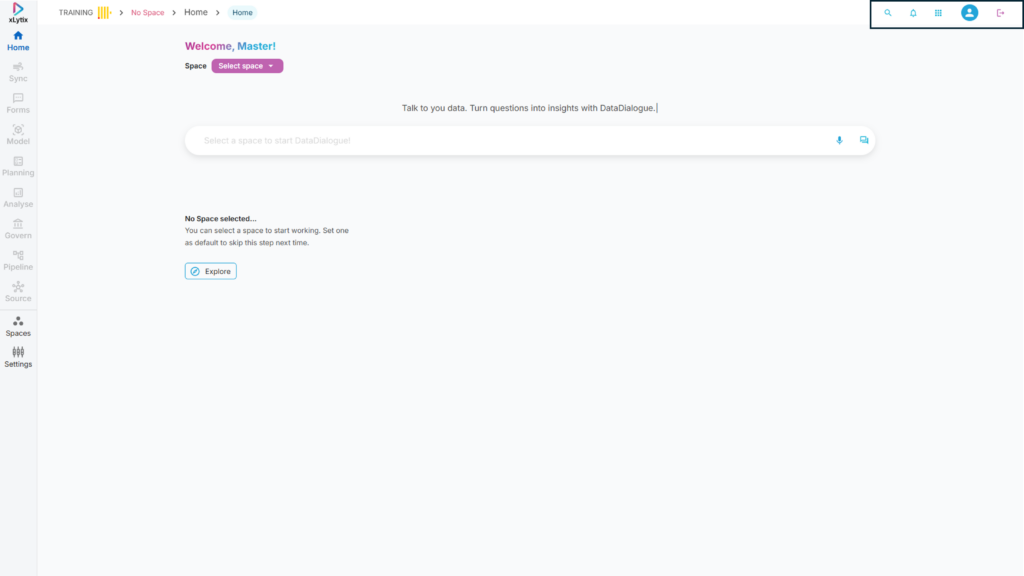
1. Search – Allows to perform search action inside the application.
2. Notifications – Notifies users of any new updates.
3. Options – Allows users to access various options such as Switch, Help, Support, Health, and License.
Switch → Allows users to switch between different subscriptions within xLytix. Help → Provides access to documentation and guidance for using xLytix features. Support → Enables users to raise queries or contact support for issue resolution. Health → Displays the current system health status and operational availability. License → Shows license details including type, validity, and subscription status.
4. User profile – Allows users to view and manage personal details, preferences (theme), and account settings such as password and logout.
Side Menu Bar #
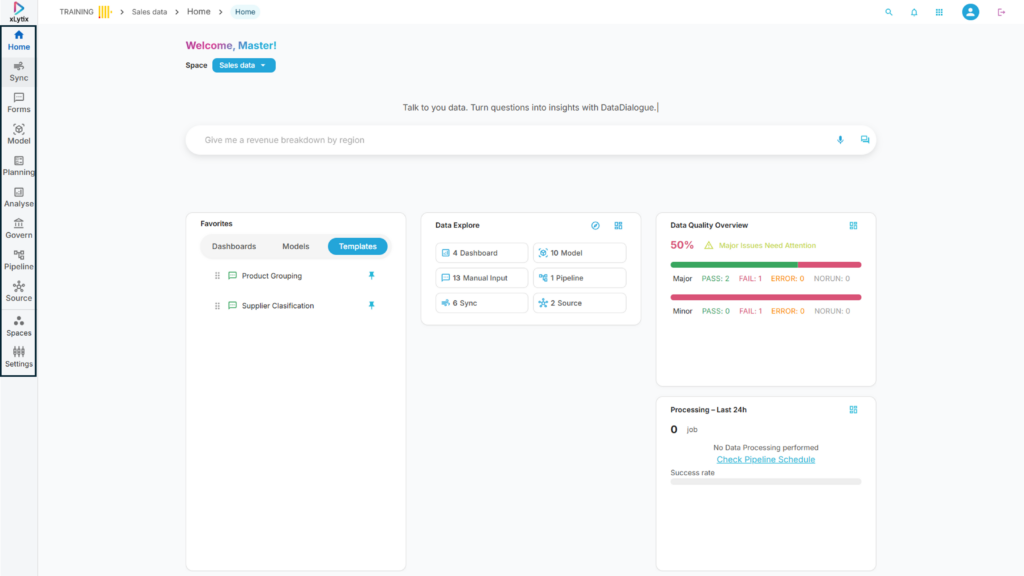
1. Home – Provides an overview of the workspace with quick access to insights, Data Dialogue, and key activities.
2. Sync – Allows users to ingest and synchronize data from various source systems into xLytix.
3. Forms – Enables creation and management of input forms for manual data entry and updates.
4. Model – Used to design and manage data models, relationships, and transformations.
5. Planning – Supports planning and forecasting activities with measures, dimensions, and scenarios.
6. Analyse – Allows users to explore and analyze data through dashboards, charts, and reports.
7. Govern – Provides data governance features such as lineage, metadata management, and data quality.
8. Pipeline – Enables creation and management of data pipelines for processing and data flow orchestration.
9. Source – Used to configure and manage data source connections.
10. Spaces – Allows management of different workspaces or environments within xLytix.
11. Settings – Provides configuration options for system setup, users, roles, and admin controls.
Ask Data Dialogue #
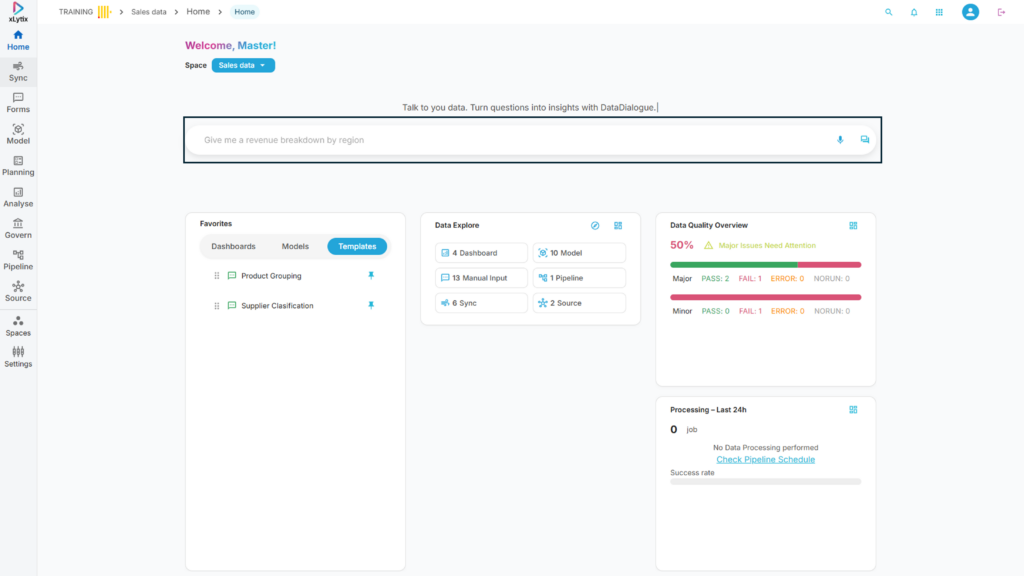
The Data Dialogue feature in xLytix allows users to interact with data using natural language queries. It enables users to ask questions related to data (e.g., trends, comparisons, summaries) and receive instant insights without building reports or dashboards.
Widgets #
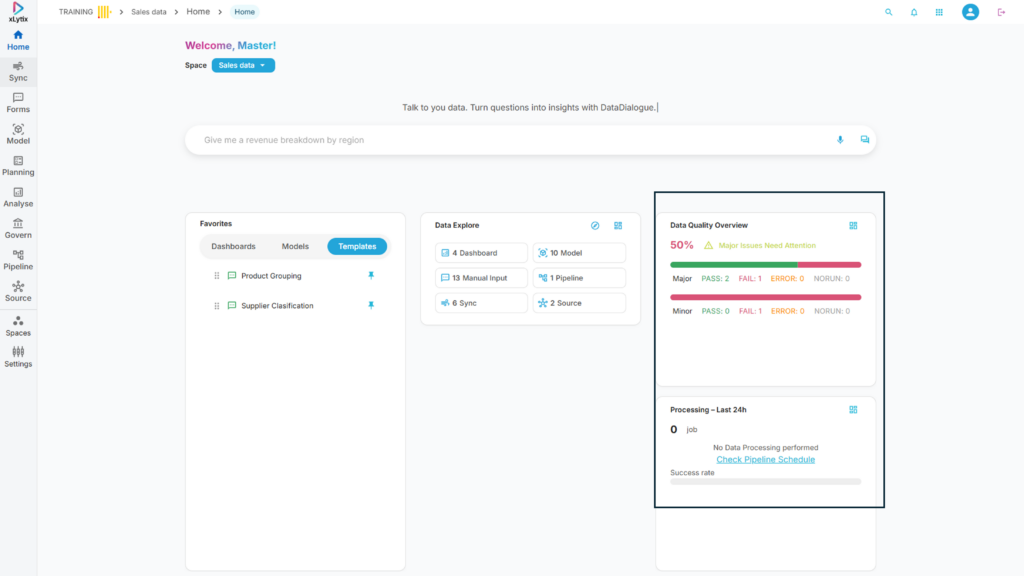
1. Data processed in last 24 hours – Shows the data processed by xLytix in last 24 hours.
2. Data Quality Checks – Shows the graphic of data quality checks performed by xLytix along with their status.
Dashboard #
The Dashboard on xLytix home screen shows users a graphical representation of the various attributes as follows;
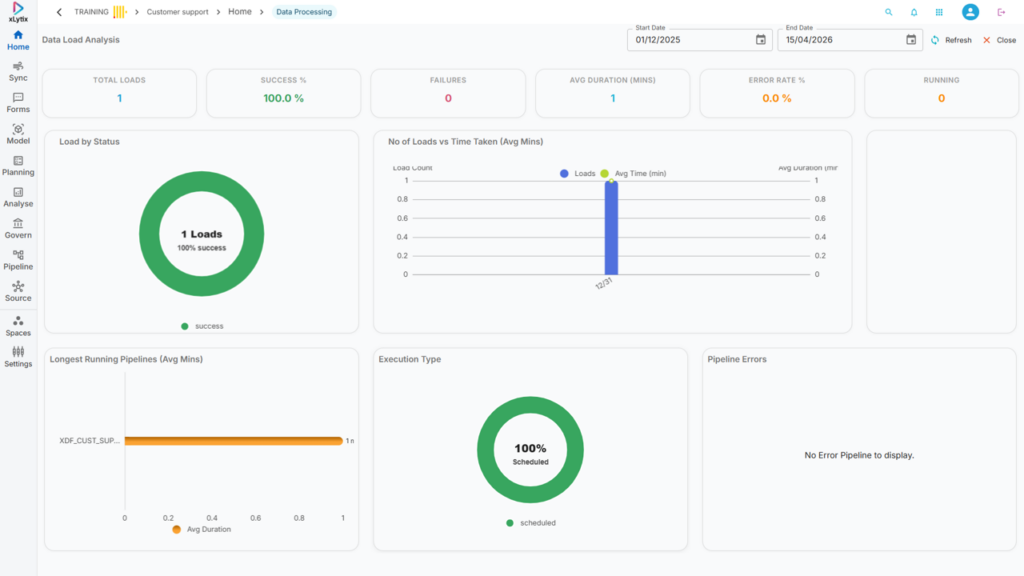
Data Processing Dashboard #
Data Load Analysis → Provides insights into pipeline execution statistics, data load performance, and processing trends over a selected time range.
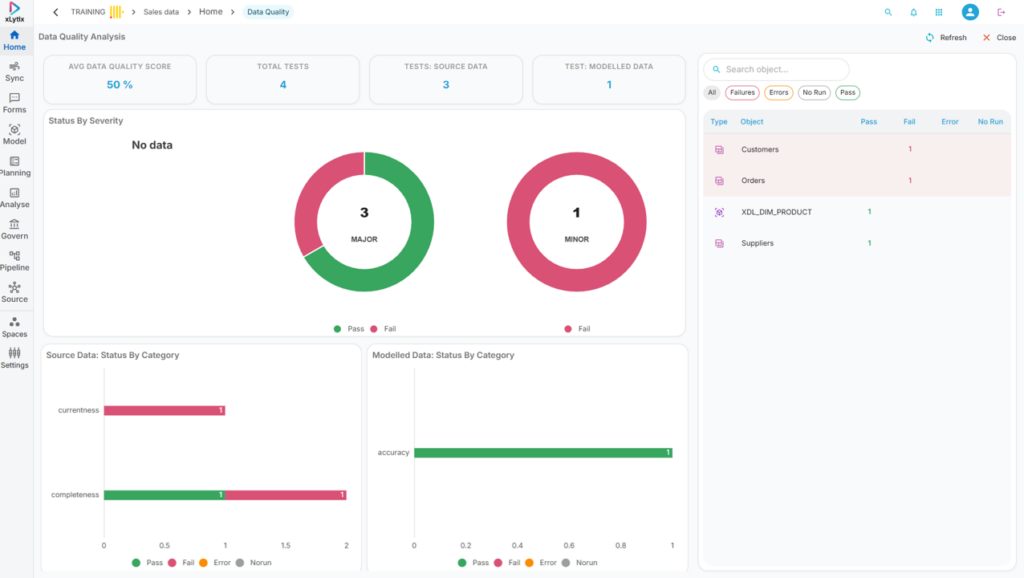
Data Quality Dashboard #
Data Quality Analytics → Provides detailed insights into data quality metrics, test results, and issue distribution across datasets.
Favourites #
Provides quick access to frequently used or pinned items for easy navigation.
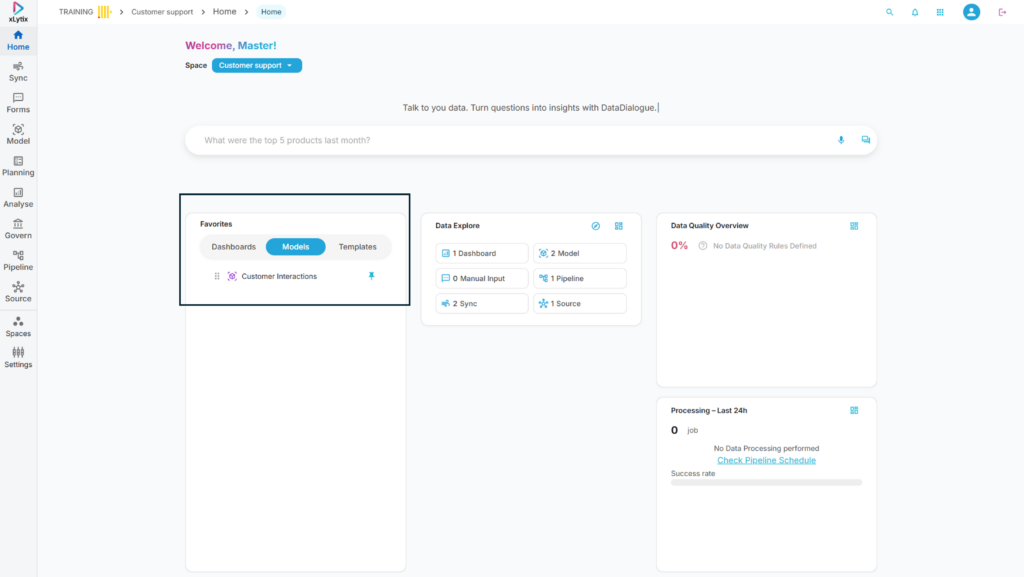
Dashboards → Displays pinned dashboards for quick access to key reports and visual insights.
Models → Shows pinned data models for quick access and management.
Templates → Lists pinned templates for reuse in forms, reports, or configurations
Data Explore #
Provides quick navigation to different sections like Dashboards, Models, Pipelines, Syncs, and Sources.
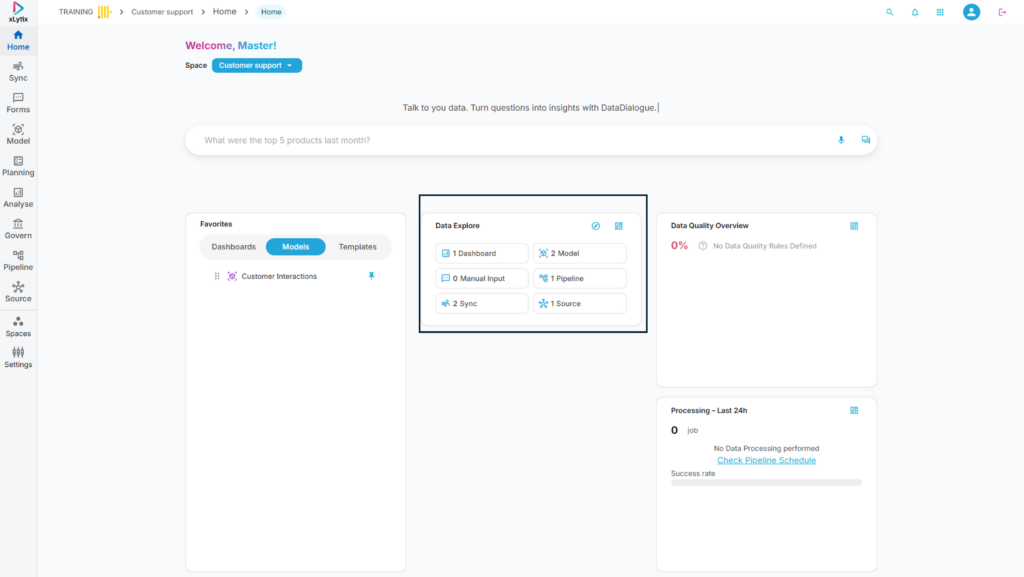
Dashboard → Navigates to the Dashboard section and displays all available dashboards.
Model → Navigates to the Model section and displays all available data models.
Manual Input → Navigates to input forms where users can create or manage manual data entries.
Pipeline → Navigates to the Pipeline section to view and manage data processing workflows.
Sync → Navigates to the Sync section to monitor and manage data ingestion jobs.
Source → Navigates to the Source section to view and manage data source connections.
Top Icons #
Add Data Glossary → Allows users to create and manage business glossary terms for better data understanding.
View Object Dashboard → Displays an overview dashboard summarizing system objects and health metrics.